|
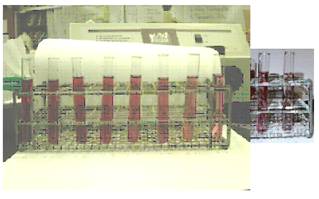
*Dearest Ms. Macke, before gasping at the horrendous
'photos,' please express foremost pity for the group who had lost most of
their pictures by the effect of Alzheimer's on a digital camera. While
you're at it, please take a moment to observe the rather excellent skills
with Microsoft Paint =D *
|
|
Part I: Measuring the Spectrum
Plug in the spectrometer and turn it on, wait 15
min for it to warm up
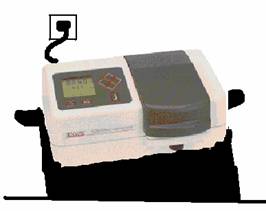
- Set the wavelength knob to
600 nm
- With the sample compartment
still empty,
- use the zero adjust
knob located on the left
- side to reading to 0%
transmittance (%T)
- and .00 absorbance (%A).
- Blank the machine by filling
one cuvette
with distilled water about ¾ of the way.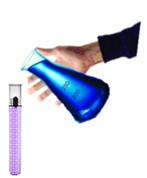
- Insert it in the sample
compartment and
close the top.
- Use the 100% adjust knob on
the right
hand side to set the reading to 100%T
with the water filled cuvette holder. 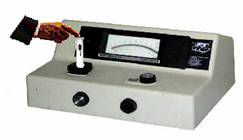
- Adjust the T/A switch to
measure the
transmittance of the water.
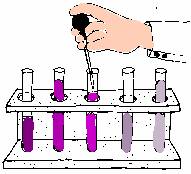
- Fill the other cuvettes with
a solution of
grape juice and water in ratios of
a)
10:0
b)
9:1
c)
8:2
d)
7:3
e)
6:4
f)
5:5
g)
4:6
h)
3:7
i)
2:8
j)
1:9
k)
0:10
- With a micropipette remove
¼ of the solution from the cuvettes (to prevent spillage into the
machine)
- Insert cuvette A into the
instrument
- and close the cover. Record
the
- transmittance reading and
the flip
- the switch and record the
absorbance
- reading.
- Remove cuvette and close the
top
- Repeat steps until all of
the cuvettes
- have been measured.
- Repeat whole procedure, for
accuracy check.
Part II: Graphing the Results
- Use the ratios with the
readings from the spectrophotometer to plot a graph for the
transmittance and absorbance
- X-axis: ratios of grape
juice to water; Y-axis: percent absorbance /transmittance
|